Penngrove Posts $37.8 Million in 27 Closings YTD, Led by a $5.5 Million Ranch That Skews Everything
The period at a glance
| Metric | Value |
|---|---|
| Period | Jan 1 – Sep 26, 2026 |
| Total closings | 27 |
| Total volume | $37,752,844 |
| Overall median price | $1,351,000 |
| Single-family median price (n=21) | $1,485,000 |
| Single-family median $/sf (n=21) | $522 |
| Single-family price range | $393,500 – $5,500,000 |
| Vacant land median price (n=5) | $800,000 |
| Vacant land price range | $275,000 – $800,000 |
| Multi-family closings | 1 (see note) |
| Median lot size | 53,143 sf |
| List prices in source | Not available |
No list prices appear in the county-record source for this period. Twenty-seven recorded sales closed between January 1 and September 26, 2026, spread across single-family homes, vacant land, and one multi-family transaction. The dataset carries no days-on-market figures for any of the 27 closings, so pace of sale cannot be described.
The number that reshapes every aggregate is the July 30 close at 6450 Quailbrook Ln: $5,500,000 on 6,330 square feet sitting on roughly 160 acres. Remove it and the single-family median would drop from $1,485,000 to $1,400,000 and the total volume figure would fall to $32,252,844. The tension in this year's record is exactly that split: seventeen of the twenty-one single-family closings landed between $625,000 and $1,625,000, while two transactions — the Quailbrook ranch and the $3,887,500 Formschlag Lane close in January — together account for nearly a quarter of all dollar volume. The land segment, with five sales all recorded on two dates in February and March, adds a separate strand that the price-band table does not fully capture.
The sales
The table below shows all 27 closings — the roster note indicates top 40 by price, and since total closings equal 27, this roster is complete.
| Address | Segment | Beds | Sq Ft | $/sf | Sale Price | Closed |
|---|---|---|---|---|---|---|
| 6450 Quailbrook Ln | Single Family | 2 | 6,330 | $869 | $5,500,000 | Jul 30 |
| 590 Formschlag Ln | Single Family | 3 | 3,895 | $998 | $3,887,500 | Jan 13 |
| 166 Davis Ln | Single Family | 3 | 1,184 | $1,394 | $1,650,000 | May 8 |
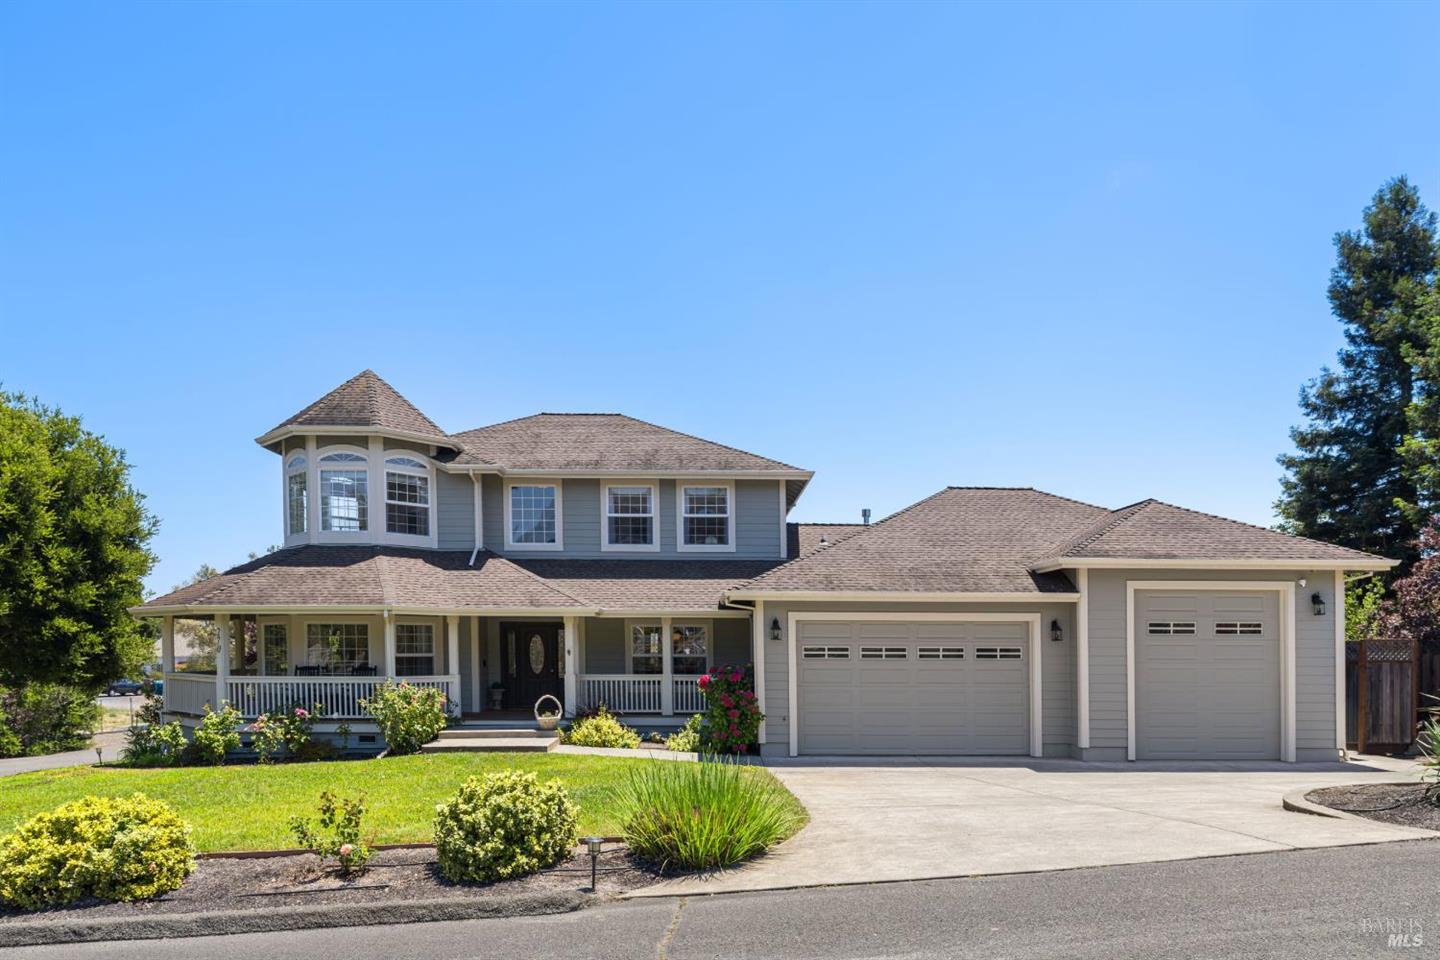
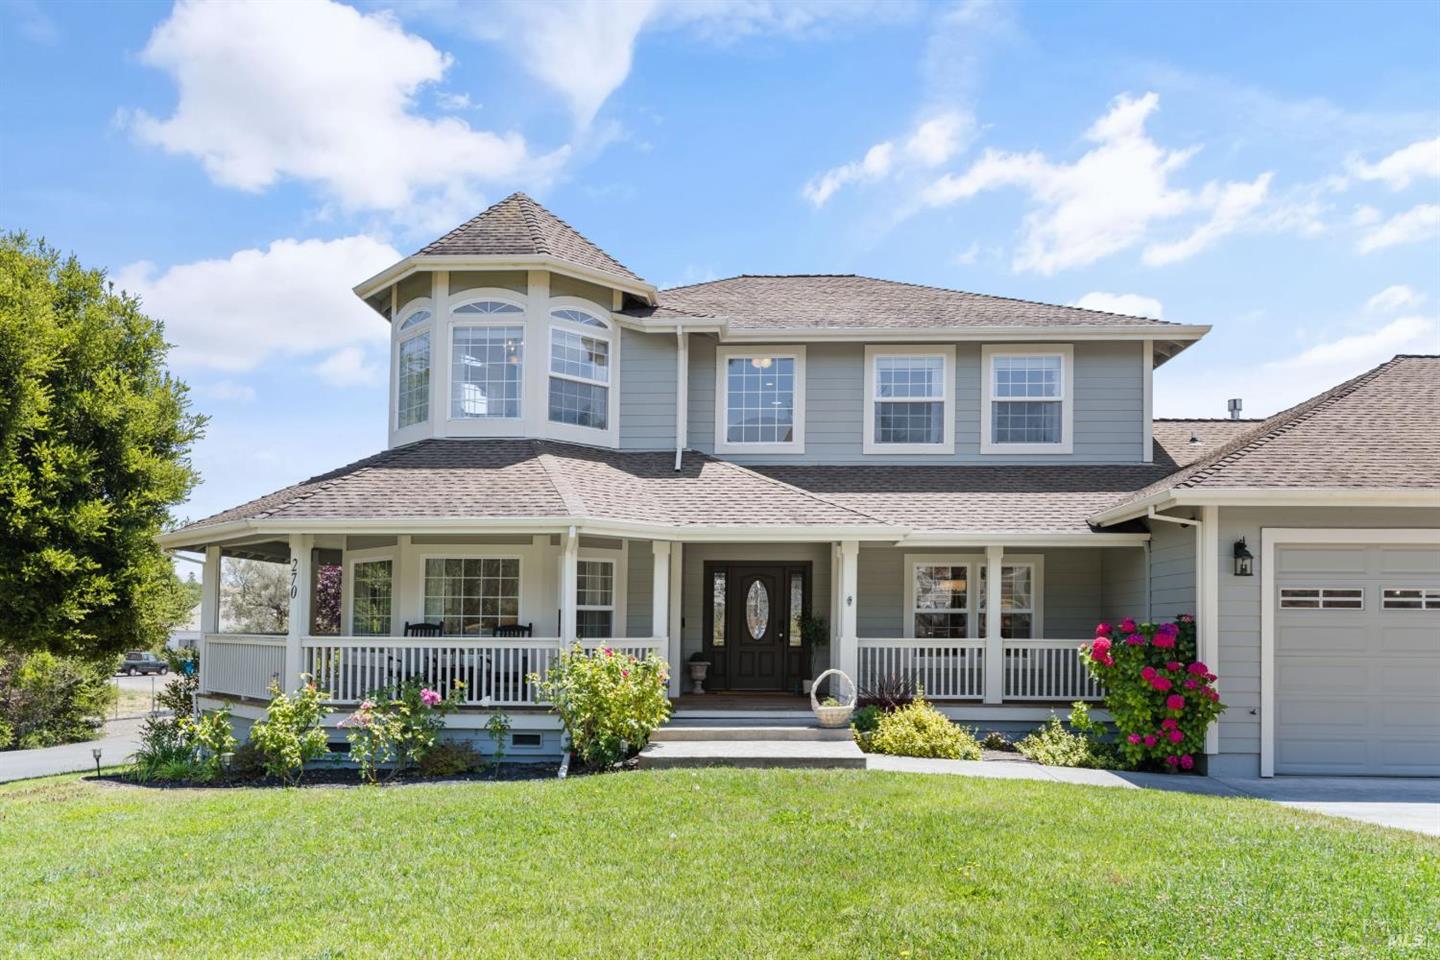
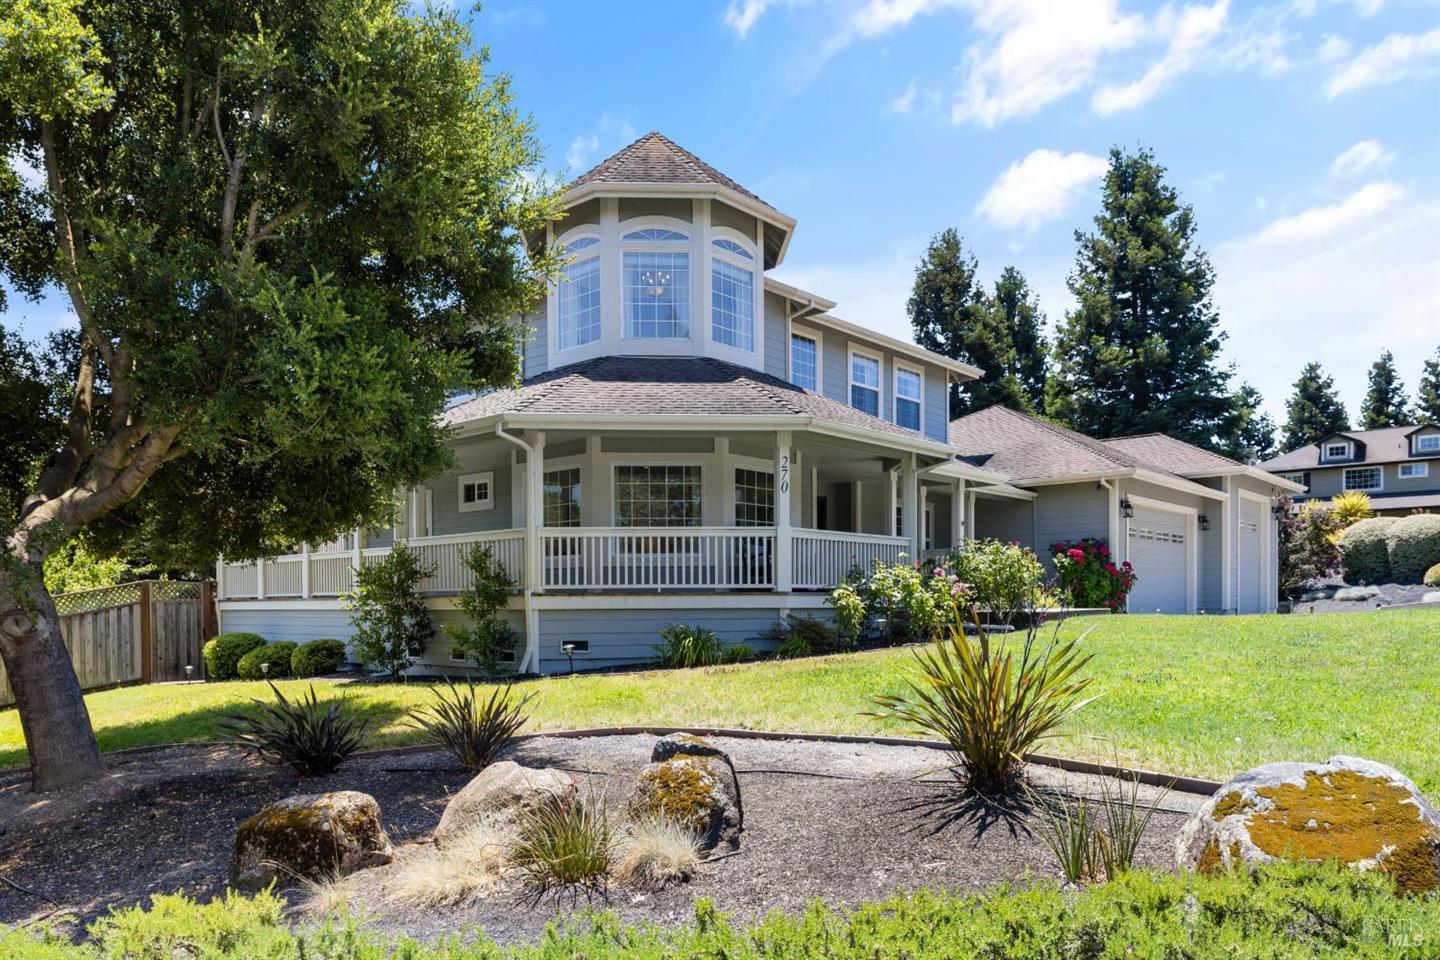
| 270 Olga Maria Ct | Single Family | 4 | 3,268 | $497 | $1,625,000 | Aug 31 |
| 270 Olga Maria Ct | Single Family | 4 | 3,268 | $497 | $1,625,000 | Sep 3 |
| 9699 Kelly Ln | Single Family | 3 | 1,505 | $1,034 | $1,556,000 | Apr 22 |
| 509 Phillips Dr | Single Family | 3 | 2,108 | $735 | $1,550,000 | Feb 9 |
| 1952 Alice Dr | Single Family | 5 | 2,948 | $522 | $1,538,422 | Jul 23 |
| 1952 Alice Dr | Single Family | 5 | 2,948 | $522 | $1,538,422 | Jun 9 |
| 236 Adobe Rd | Single Family | 6 | 3,512 | $429 | $1,507,000 | Apr 6 |
| 6649 Round Oak Rd | Single Family | 3 | 2,292 | $648 | $1,485,000 | Aug 21 |
| 125 Adobe Rd | Single Family | 5 | 4,096 | $361 | $1,480,000 | Jul 23 |
| 130 Goodwin Ln | Single Family | 2 | 2,279 | $614 | $1,400,000 | Jun 3 |
| 442 Ronsheimer Rd | Single Family | 4 | 2,660 | $508 | $1,351,000 | Jul 23 |
| 2294 Chester Dr | Single Family | 3 | 1,723 | $740 | $1,275,000 | Sep 12 |
| 4705 Acacia Way | Single Family | 2 | 1,793 | $684 | $1,226,000 | Sep 17 |
| 1707 Weiss Ln | Single Family | 5 | 2,704 | $444 | $1,200,000 | May 11 |
| 6960 Round Oak Rd | Single Family | 3 | 2,437 | $451 | $1,100,000 | Sep 9 |
| 9982 Oak St | Vacant Land | — | — | — | $800,000 | Feb 23 |
| 9980 Oak St | Vacant Land | — | — | — | $800,000 | Feb 23 |
| 0 Oak St | Vacant Land | — | — | — | $800,000 | Feb 23 |
| 9483 Old Redwood Hwy | Single Family | 2 | 962 | $832 | $800,000 | May 18 |
| 2095 Goodwin Ave | Single Family | 2 | 1,269 | $493 | $625,000 | Jul 31 |
| 0 Alan Dr | Vacant Land | — | — | — | $500,000 | Mar 26 |
| 9989 Oak St | Single Family | 2 | 2,134 | $184 | $393,500 | Apr 29 |
| Grove St | Vacant Land | — | — | — | $275,000 | May 5 |
| 1190 Dutch Ln | Multi-family | 3 | 1,316 | $201 | $265,000 | Jun 11 |
Four transactions deserve closer reading. The $5,500,000 close at 6450 Quailbrook Ln — a 2012-built, 2-bedroom home on what the record shows as approximately 160 acres — produced a per-square-foot figure of $869, among the highest in the period on finished area, though the lot accounts for most of the story. At 590 Formschlag Ln, a 3,895-square-foot, three-bedroom built in 1994 closed in January at $3,887,500 ($998/sf), the highest per-square-foot figure among homes over 2,000 square feet. Across town, 166 Davis Ln — a 1975-vintage three-bedroom at just 1,184 square feet — closed at $1,394/sf, the highest rate in the entire period; at $1,650,000 it also ranks as the third-highest close, demonstrating that Penngrove's older smaller homes on generous parcels (the lot here runs to nearly 6.9 acres) carry their own premium tier. Finally, the record shows 270 Olga Maria Ct appearing twice — August 31 and September 3 — at the identical price of $1,625,000. Both entries share the same parcel details. The report carries both as recorded; an editor should verify with the county whether this is a correction, a re-recording, or a data artifact.
The three Oak Street vacant parcels — 9982, 9980, and 0 Oak St — each at $800,000 on the same date (February 23), each showing 7,500 square feet of lot, read as a coordinated multi-parcel close. Combined, they represent $2,400,000 in a single day's land activity.
Where the market split
By segment
| Segment | Closings | Low | Median | High | Median $/sf |
|---|---|---|---|---|---|
| Single Family | 21 | $393,500 | $1,485,000 | $5,500,000 | $522 |
| Vacant Land | 5 | $275,000 | $800,000 | $800,000 | n/a |
| Multi-family | 1 | $265,000 | — | $265,000 | $201 |
Single-family is the engine: 21 of 27 closings, roughly 92 cents of every volume dollar, and the segment where the full range of Penngrove's character shows — from the 1956-vintage 9989 Oak St at $393,500 to the Quailbrook ranch at $5,500,000. The $522 median per square foot across 21 transactions reflects a market where size and lot vary enough that the rate itself spans $184 to $1,394.
The five vacant land closings carry a median of $800,000, pulled there by the three Oak Street parcels. The lone outlier downward is Grove Street at $275,000 (12,588 sf). The fourth land close, 0 Alan Dr at $500,000 on a 49,222-square-foot parcel, sits between those clusters.
The single multi-family close — 1190 Dutch Ln at $265,000 — is the lowest-priced transaction in the period. With one sale, no median is meaningful; the record shows only the range: $265,000 to $265,000.
By price band
| Price Band | Closings | Median $/sf |
|---|---|---|
| Under $1M | 9 | $347 |
| $1M – $1.5M | 8 | $561 |
| $1.5M – $2M | 8 | $522 |
| $2M – $3M | 0 | — |
| $3M – $5M | 1 | $998 |
| $5M and up | 1 | $869 |
The $2M–$3M band recorded no closings in the period. That gap between the eight homes in the $1.5M–$2M tier and the single transaction at $3,887,500 is not a rounding artifact — the record simply shows nothing in that $900,000 stretch. Whether that reflects the available stock, the structure of Penngrove's housing inventory, or something else cannot be determined from the transaction record alone.
The $1M–$1.5M band's median of $561/sf running above the $1.5M–$2M band's $522/sf is not a misprint. In the $1M–$1.5M range, smaller-footprint homes (Kelly Ln at 1,505 sf, Old Redwood Hwy at 962 sf) push the per-square-foot rate up even as the total price sits lower. In the $1.5M–$2M band, larger homes (Alice Dr at 2,948 sf, Adobe Rd at 3,512 and 4,096 sf) bring the rate down despite higher price tags.
Across the period
| Month | Closings | Median Price | Median $/sf |
|---|---|---|---|
| Jan 2026 | 1 | $3,887,500 | $998 |
| Feb 2026 | 4 | $800,000 | $735 |
| Mar 2026 | 1 | $500,000 | — |
| Apr 2026 | 3 | $1,507,000 | $429 |
| May 2026 | 4 | $1,000,000 | $832 |
| Jun 2026 | 3 | $1,400,000 | $522 |
| Jul 2026 | 5 | $1,480,000 | $508 |
| Aug 2026 | 2 | $1,555,000 | $573 |
| Sep 2026 | 4 | $1,250,500 | $591 |
Months with one or two closings — January, March, August — produce medians that reflect a single transaction or a single pair, not a meaningful mid-range. January's $3,887,500 median is one house. March's null $/sf is one vacant land parcel with no structure. Read those rows as individual data points, not as market signals.
The months with three or more closings show a different texture. February's $800,000 median is anchored by the three Oak Street land parcels closing the same day, with a single-family home (509 Phillips Dr, $1,550,000) as the outlier above. April through September, with the land closings mostly behind it, the record shows single-family transactions dominating and the monthly median price broadly in the $1.2M–$1.6M corridor — with July posting the period's highest multi-sale month at five closings and a $1,480,000 median. September's four closings came in at a $1,250,500 median, the lowest among months with three or more transactions since April.
Volume by count was most concentrated in July (5 closings) and lightest in January and March (1 each). Total recorded volume of $37,752,844 across nine months represents an average closing pace of roughly three transactions per month.
What it means
For sellers
The 2026 record to date shows a market with a well-occupied $1M–$2M corridor — sixteen of twenty-seven closings fell there — and a demonstrable but thin market above $3M. Two of the year's twenty-seven transactions exceeded $3M; both involved distinctive properties (large acreage, large improved square footage on a rural parcel). The gap at $2M–$3M is a feature of the recorded transaction set, not an assertion about what would or would not transact in that range. The absence of list prices in the source means the relationship between asking and closing figures cannot be described.
For buyers
The 27 closings span $265,000 to $5,500,000, and nine of them settled below $1,000,000 — a mix of vacant land, one multi-family, and two single-family homes (9483 Old Redwood Hwy at $800,000 and 9989 Oak St at $393,500). The under-$1M single-family inventory that actually closed is thin: two homes in nine months, one of which is a 1956-vintage 2-bedroom at $184/sf that likely reflected condition. No days-on-market figures are available in this source, so how long any of these properties were available before closing is not known.
For owners not transacting
The per-square-foot record for the single-family segment — 21 closings, median $522/sf, range $184–$1,394 — underlines how widely individual property characteristics drove individual outcomes. The highest rate ($1,394/sf at 166 Davis Ln) was on one of the smallest homes in the set. The lowest rate ($184/sf at 9989 Oak St) was on a home of similar vintage but larger footprint. Lot size, condition, and year built each appear to play a role the aggregate figures cannot disentangle.
Jake Taylor · CA DRE #02070119
[email protected] · (707) 630-1001
More from Penngrove
Clean Your Gutters Before October: A Penngrove Pre-Rain Checklist
More than half of Penngrove's homes were built before 1980, and many sit on lots over an acre with mature trees overhead. September is the right month to get the gutters clear before the first storm does it for you.
What Your Penngrove Parcel Actually Allows: Reading Sonoma County Zoning
Penngrove is unincorporated, so every land-use question goes to Permit Sonoma, not a city hall. Here is how the county's zoning system works and what it means for the 327 single-family parcels here that sit on an acre or more.

Penngrove's Fire Zone Map Just Changed. Here's What It Means for Your Parcel.
CAL FIRE released updated fire hazard severity zone maps for unincorporated areas in early 2025, replacing maps that were 15 to 18 years old. For Penngrove—where most lots are an acre or larger and most homes predate 1980—the zone your parcel lands in now carries real building and disclosure consequences.