Penngrove Q3 2026: 11 Sales, $18.8M in Volume, Anchored by a $5.5M Ranch
The period at a glance
| Metric | Q3 2026 |
|---|---|
| Closings | 11 |
| Total volume | $18,830,422 |
| Median sale price | $1,480,000 |
| Median price per sq ft | $508 |
| Median home size | 2,660 sq ft |
| Median lot size | 27,878 sq ft |
| Price range | $625,000 – $5,500,000 |
| List prices available | No |
| Days on market reported | 0 of 11 |
This report covers 11 recorded closings in Penngrove during Q3 2026 — a small sample that keeps medians suggestive rather than definitive and makes month-to-month swings easy to produce with a single transaction. No list prices appear in the county record and MLS export for this period, so no comparison to asking price is possible. Days-on-market figures were not recorded for any of the 11 closings, so speed of sale is not discussed.
The $5.5M sale at 6450 Quailbrook Ln is the most consequential single fact of the quarter. Remove it and total volume drops to $13.3M, the median barely moves (to $1,351,000), and the picture is of a tightly grouped market in the $1.1M–$1.6M corridor. Include it and the quarter carries a headline number that overstates how the other ten transactions behaved. Both readings are accurate; the range of $625,000 to $5,500,000 captures the spread.
The sales
| Address | Closed | Beds | Sq Ft | Lot Sq Ft | $/Sq Ft | Sale Price | Year Built |
|---|---|---|---|---|---|---|---|
| 6450 Quailbrook Ln | Jul 30 | 2 | 6,330 | 6,969,600 | $869 | $5,500,000 | 2012 |
| 270 Olga Maria Ct | Aug 31 | 4 | 3,268 | 14,892 | $497 | $1,625,000 | 2004 |
| 270 Olga Maria Ct | Sep 3 | 4 | 3,268 | 14,892 | $497 | $1,625,000 | 2004 |
| 1952 Alice Dr | Jul 23 | 5 | 2,948 | 24,481 | $522 | $1,538,422 | 2026 |
| 6649 Round Oak Rd | Aug 21 | 3 | 2,292 | 185,130 | $648 | $1,485,000 | 2000 |
| 125 Adobe Rd | Jul 23 | 5 | 4,096 | 23,971 | $361 | $1,480,000 | 1914 |
| 442 Ronsheimer Rd | Jul 23 | 4 | 2,660 | 20,000 | $508 | $1,351,000 | 1997 |
| 2294 Chester Dr | Sep 12 | 3 | 1,723 | 27,878 | $740 | $1,275,000 | 1976 |
| 4705 Acacia Way | Sep 17 | 2 | 1,793 | 57,064 | $684 | $1,226,000 | 1972 |
| 6960 Round Oak Rd | Sep 9 | 3 | 2,437 | 198,634 | $451 | $1,100,000 | 1963 |
| 2095 Goodwin Ave | Jul 31 | 2 | 1,269 | 106,286 | $493 | $625,000 | 1906 |
The roster shows all 11 closings, which is also the full period count.
Four transactions carry most of the narrative weight.
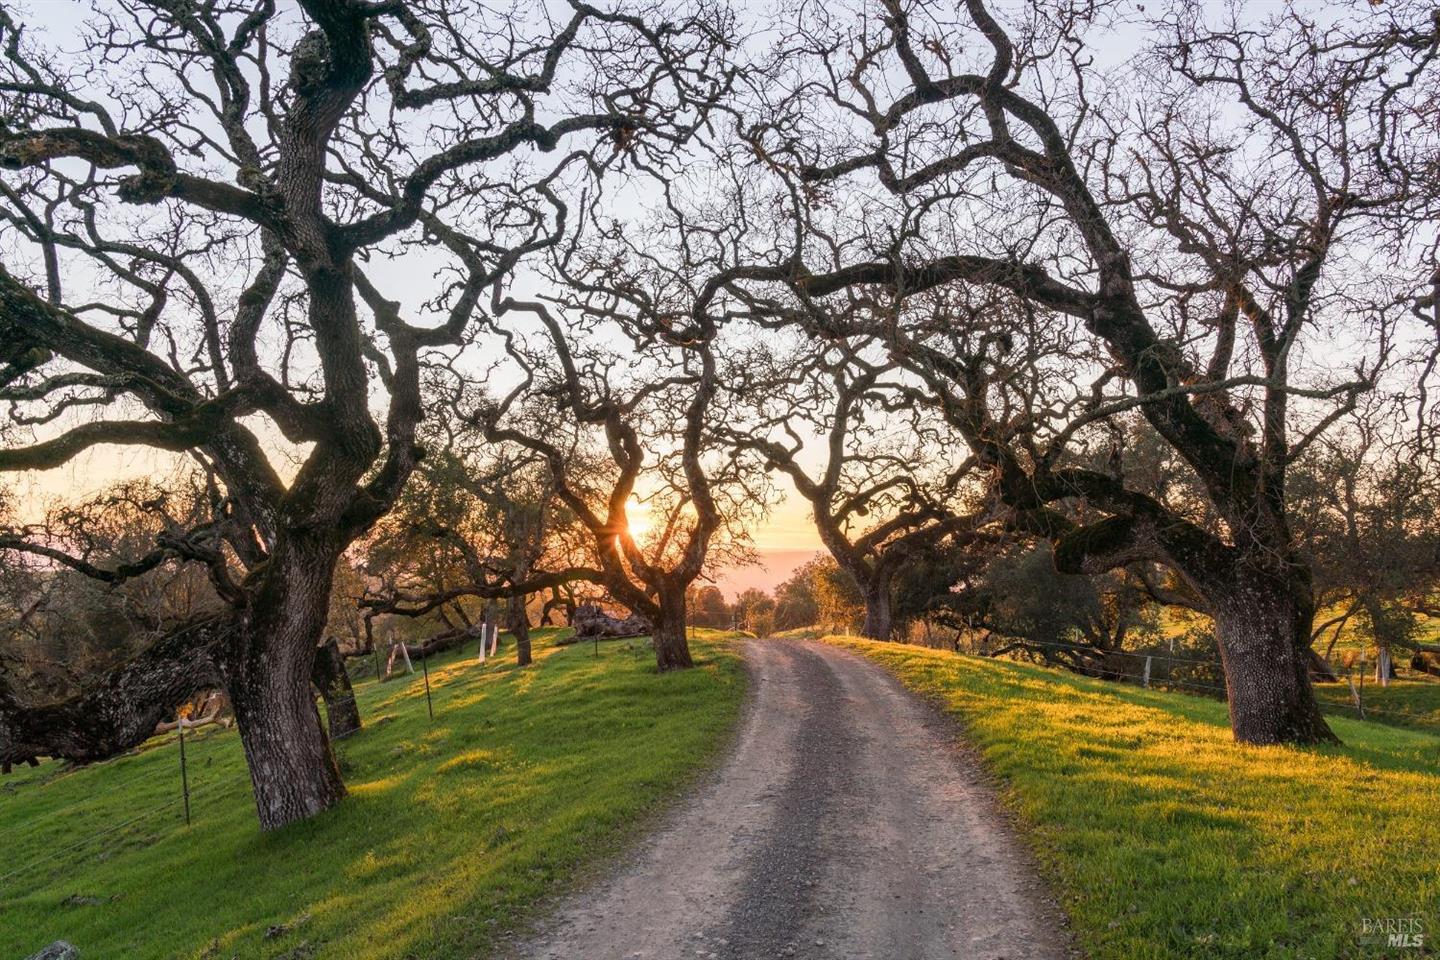
6450 Quailbrook Ln closed July 30 at $5,500,000 — the quarter's only sale above $2M and the only one with a lot measured in acres rather than square feet (160 acres, or 6,969,600 sq ft). At $869/sq ft on 6,330 sq ft of living space built in 2012, it sits in a category of its own within this 11-sale period.
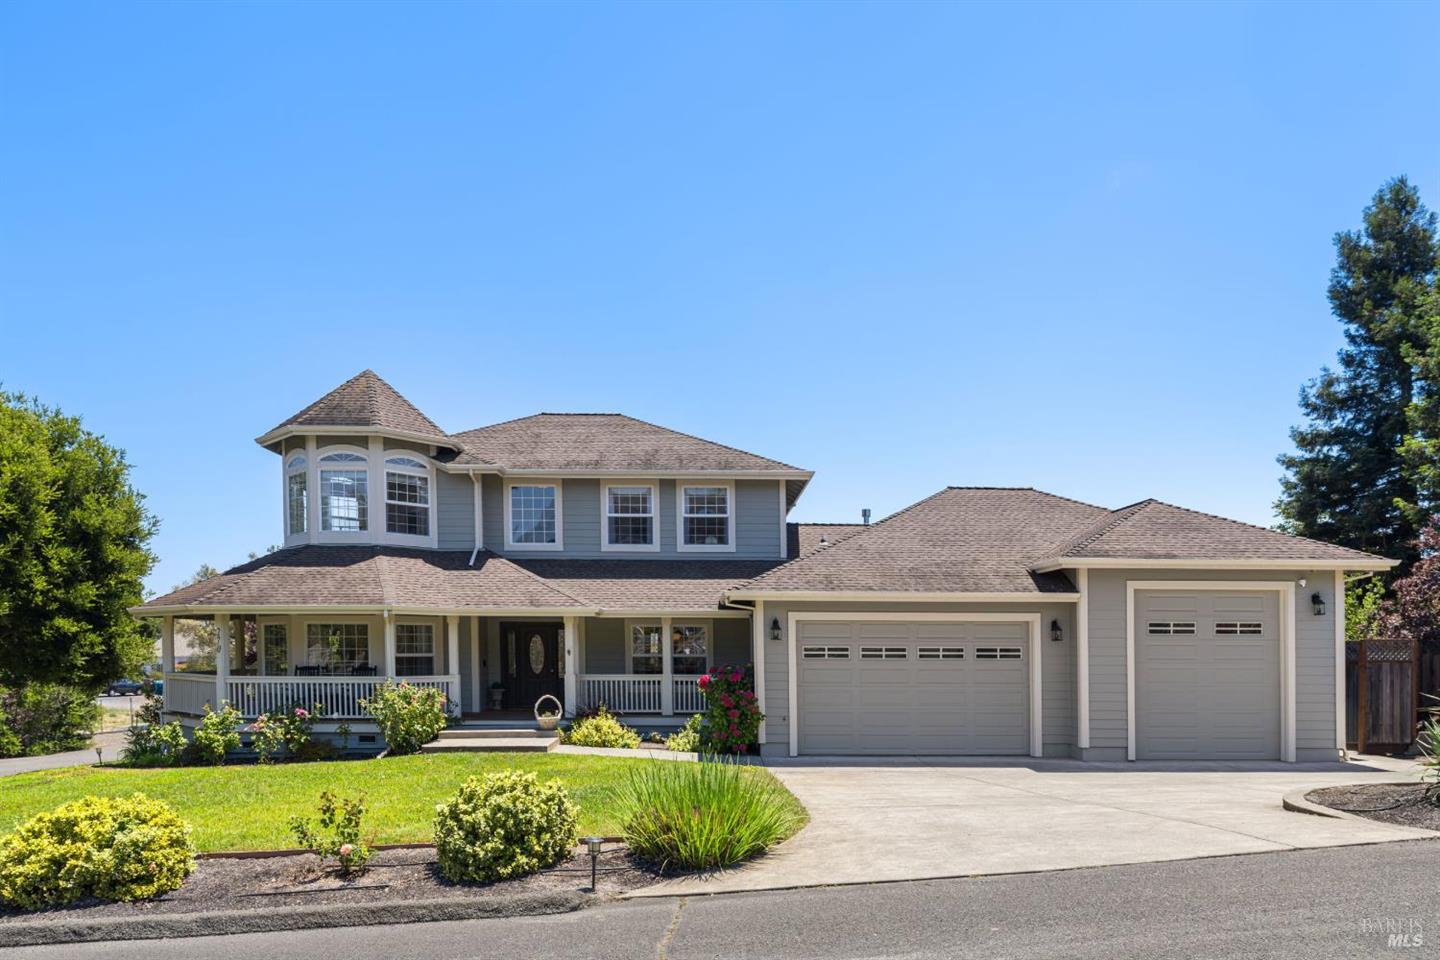
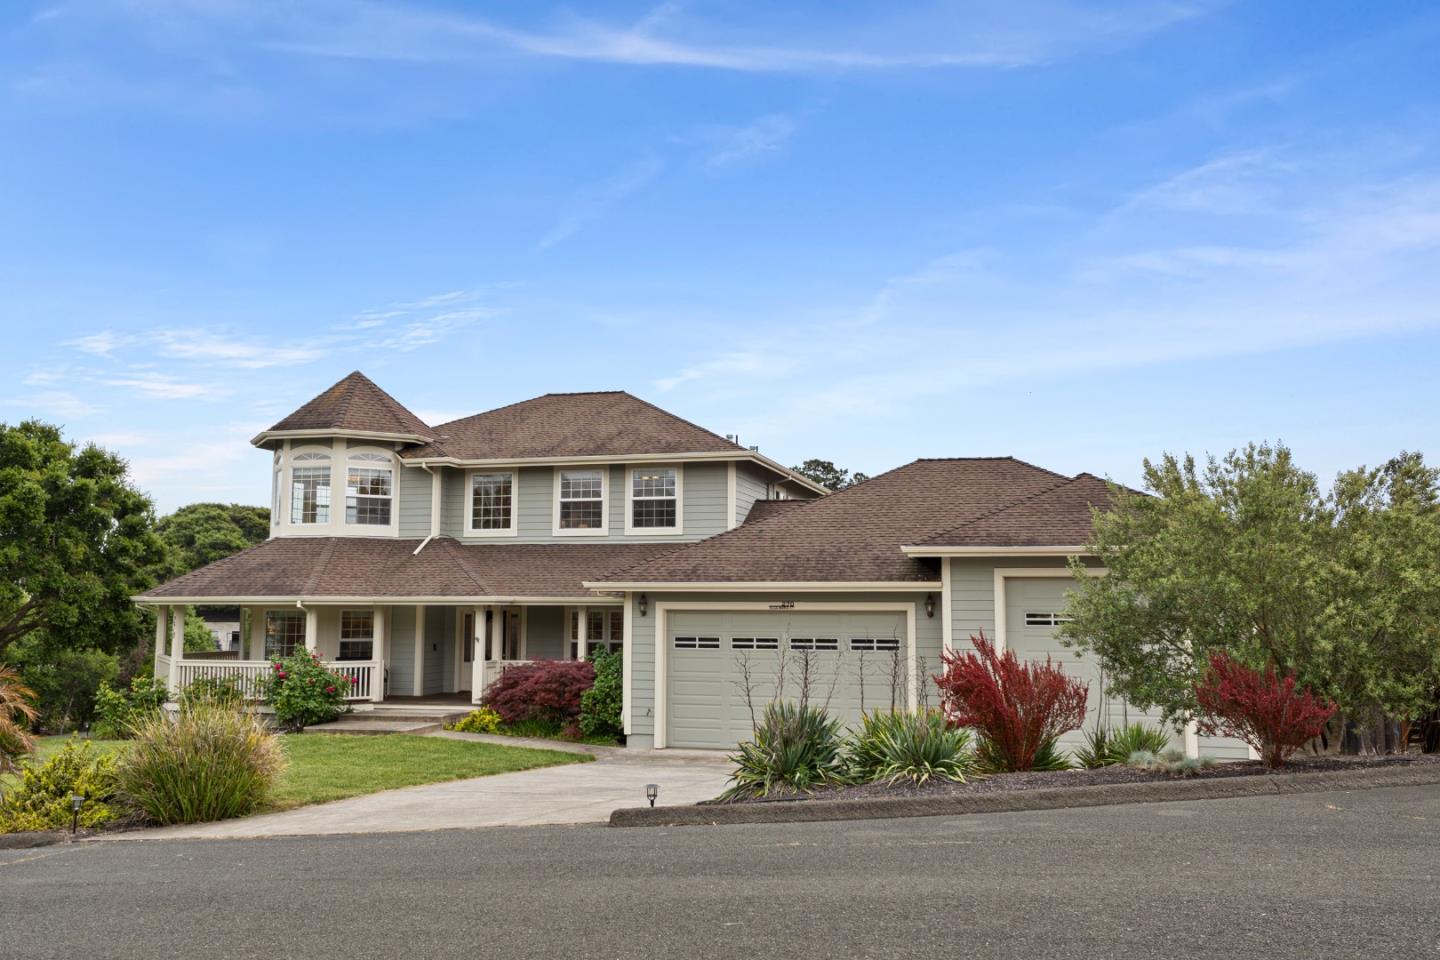
270 Olga Maria Ct appears twice in the record, closing at $1,625,000 on both August 31 and September 3 on identical figures — same address, same beds, same square footage, same price per square foot. The county record shows two separate closing dates three days apart. This is flagged for editorial review; it may reflect a re-recording or a data artifact, and readers should treat this address as one transaction until confirmed otherwise.
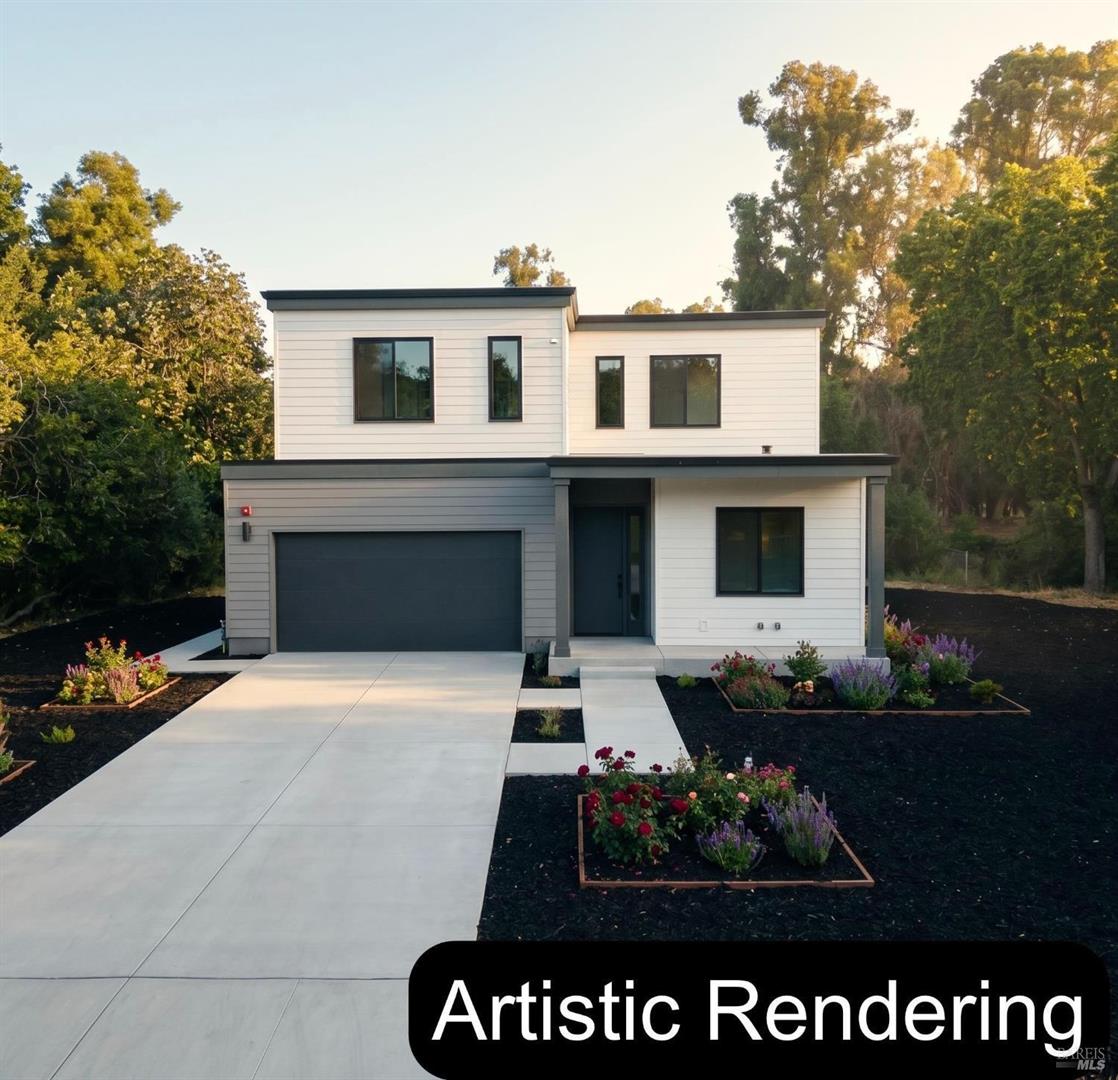
1952 Alice Dr closed July 23 at $1,538,422 — a 2026-built five-bedroom on just over half an acre. It is the only new construction in the quarter's record and the odd sale price (ending in $422 rather than a round number) suggests a negotiated or formula-based final figure.
125 Adobe Rd closed the same day at $1,480,000 for a 1914-built five-bedroom spanning 4,096 sq ft — the largest non-estate home in the period. At $361/sq ft, it recorded the lowest price per square foot of any closing except the Round Oak Rd property at $451. The age of the structure and the size of the footprint account for part of that gap.
Where the market split
By segment
| Segment | Sales | Median Price | Median $/Sq Ft | Price Range |
|---|---|---|---|---|
| Single Family | 11 | $1,480,000 | $508 | $625,000 – $5,500,000 |
All 11 closings were single-family detached homes. No condos, townhomes, or multi-unit properties recorded in Q3 2026.
By price band
| Price Band | Sales | Median $/Sq Ft | Notes |
|---|---|---|---|
| Under $1M | 1 | $493 | Single sale; no median applicable |
| $1M – $1.5M | 6 | $578 | Largest cohort; median from 6 sales |
| $1.5M – $2M | 3 | $497 | Median from 3 sales |
| $2M – $5M | 0 | — | No activity recorded |
| $5M and up | 1 | $869 | Single sale; no median applicable |
The $1M–$1.5M band held six of the eleven closings and a median of $578/sq ft, which is higher than the $497/sq ft recorded in the $1.5M–$2M band. That inversion — smaller-dollar homes fetching more per square foot than larger ones — is explained by size: the three homes in the $1.5M–$2M band averaged 3,161 sq ft, while the six in the $1M–$1.5M band averaged 2,285 sq ft. Larger homes routinely register lower per-square-foot figures; the phenomenon is structural, not a commentary on relative value.
The $2M–$5M band recorded zero closings. Whether that reflects the local price ceiling, the character of available inventory, or the small sample is impossible to determine from 11 transactions alone.
The single sale below $1M — 2095 Goodwin Ave at $625,000 — is a 1,269 sq ft, two-bedroom home built in 1906 on a 2.4-acre lot. It stands apart from the rest of the quarter on nearly every dimension.
Across the quarter
| Month | Closings | Median Price | Median $/Sq Ft |
|---|---|---|---|
| Jul 2026 | 5 | $1,480,000 | $508 |
| Aug 2026 | 2 | $1,555,000 | $573 |
| Sep 2026 | 4 | $1,250,500 | $591 |
July produced five closings with a median of $1,480,000. August produced two — both above $1.48M — which pushed the two-sale median to $1,555,000; with only two closings, that figure describes those two transactions rather than a trend. September's four closings carried a lower median price ($1,250,500) but a higher median per-square-foot ($591), which reflects a mix shift toward smaller homes: the two September sales below $1.3M were both under 1,800 sq ft, pulling the price median down while the per-square-foot figure held or rose.
Three data points across three months, with the middle month holding only two closings, do not support a directional read on where the quarter was heading. The numbers are documented; the trajectory is not.
What it means
For sellers. Penngrove recorded $18.8M in closed volume across 11 transactions in Q3 2026. Nine of the 11 sales fell between $1.1M and $1.6M, with the exception of one outlier at each end. The lone sub-$1M sale involved a 120-year-old structure; the lone $5M-plus sale involved 160 acres. For a conventional single-family home in the $1M–$1.6M corridor, Q3 produced a workable comp set of roughly eight to nine sales — enough to frame a price discussion, not enough to call a trend.
For buyers. The $2M–$5M range produced no recorded closings in the quarter. That absence is a factual gap, not an interpretation. The active range was narrow: six of eleven sales fell within a $385,000 spread ($1,100,000 to $1,485,000). No list prices are available in the source data, so how those closing figures related to asking prices is not documented here.
For owners not transacting. Eleven closings over three months in a small community like Penngrove is a thin record. The quarter's median of $1,480,000 on a median 2,660 sq ft home provides a reference point, but any single subsequent sale will move that figure. Owners watching the market for their own planning purposes should weight the individual comp addresses — particularly the cluster of July 23 closings at $1,351,000–$1,538,422 — more heavily than the aggregate statistics a sample this size can sustain.
Jake Taylor · CA DRE #02070119
[email protected] · (707) 630-1001
More from Penngrove

425 Penngrove Homes Were Built Before Fire Safety Rules Existed
Most Penngrove homes predate modern fire-resistant building standards, and the majority sit on large lots surrounded by vegetation. Here is where embers find a way in, and what to do about it in a practical order.

Private Wells in Penngrove: What the County Requires, What Lenders Ask, and What Owners Should Know
More than 300 single-family lots in Penngrove sit on an acre or more, and most of them rely on a private well. Here is what the county requires, what lenders will ask, and how to stay ahead of it.
Clean Your Gutters Before October: A Penngrove Pre-Rain Checklist
More than half of Penngrove's homes were built before 1980, and many sit on lots over an acre with mature trees overhead. September is the right month to get the gutters clear before the first storm does it for you.